A Coastal Risk Framework for Tropical Coastal Storm Surge Risk
The development of this framework was presented at the international Ocean Sciences Meeting 2024 in New Orleans. You can view the poster by clicking here: ![]()
Bespoke storm surge and flood risk assessments play a crucial role in empowering coastal communities to build resilience to the impacts of tropical cyclones. Our novel modelling framework accurately estimates the magnitude of these risks, going from cyclone tracks to very high resolution projections of flood extent. Forming a part of our extensive climate assessment suite, this framework is designed to be efficient and flexible, ensuring delivery within 6 weeks for anywhere in the world. As risk profiles change with rising sea levels and evolving storms, the need for this type of analysis is growing. Here, we present the framework for three at-risk regions around the world which demonstrate this need and the full range of the framework.
Overview
The framework consists of three key modelling components:
Hurricane Model
3000 years of synthetic tracks from the STORM dataset [3,4] are expanded into 2 dimensional pressure and wind stress fields using the Holland model [5] and a parametric wind stress relationship [6]. These fields are used to force an ocean model. Wind and pressure fields are generated using the ParaTC Python package.
Ocean Model
The Regional Ocean Modelling System (ROMS) [7] is used to simulate sea surface height. The domain is generated using bathymetry from GEBCO2023 and uses wetting and drying. 1km grids can be nested within larger 5-10km grids to provide high resolution analyses.
The ocean ROMS component of the framework is validated by comparing simulated storm surge heights with those measured at tide gauges. Measured storm surge heights are estimated by subtracting a tidal harmonic analysis using the UTide Python package. This is done according to the guidelines set out in [9].
This validation be done for any region of interest, however time series lengths are often short. Here, we have validated the ROMS configuration against 11 tide gauges around the U.S. for 58 tropical cyclone events. The results are shown below:
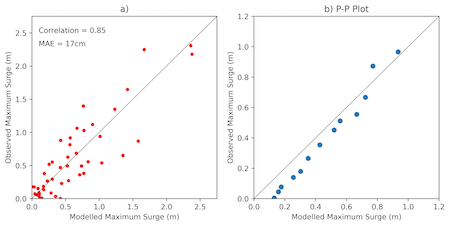
The ROMS model compares will with observations. For maximum surge, we see a correlation of ~0.84 and Maximum Absolute Error of 17cm. Percentiles are also important as we will be using this framework to estimate return levels. Our validation shows good agreement here too, with some overestimation for lower percentiles, but a correction at higher levels.
Inundation Model
LISFLOOD-FP is used to simulate inundation at a very high resolution (1-30m) using a machine learning enhanced digital elevation model [8]. Where available, coastal defenses and structures are incorporated. See our flooding page for more information.
Connecting ROMS to the Flood Model
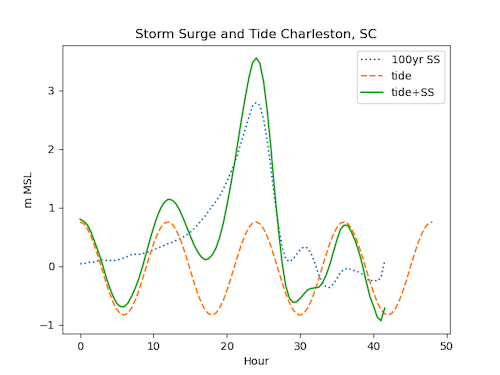
The final output from the ROMs analysis is a set of return levels along the coast. This tells us about the maximum surge height, however does not tell us about water level time series or total water levels (including tide) relative to a locally relevant datum. Therefore, we use information from ROMS to generate statistical storm surge time series that can be used to provide water level boundary conditions to the flood model.
For each event, time series are stored at all coastal locations. These time series are then binned by their maximum height. These bins are based on the percentiles of all heights seen at each locations. Inside the bins, each storm surge profile is normalized by its maximum height and averages to generate a normalized statistical profile. This can be scaled according to the maximum height desired.
Once the storm surge profile is generated, we add an oscillating time series which mimics the tide. For a given location, this time series is generated between Maximum High Water (MHW) and Maximum Low Water (MLW). To generate the total water level, the statistical profile and tidal profile are summed together so that the maximum surge coincides with MHW. This means our flood extent estimates can be considered a reasonable worst case for the 100-year surge event. See the image below for an illustration of this process.
Regional Storm Surge Examples
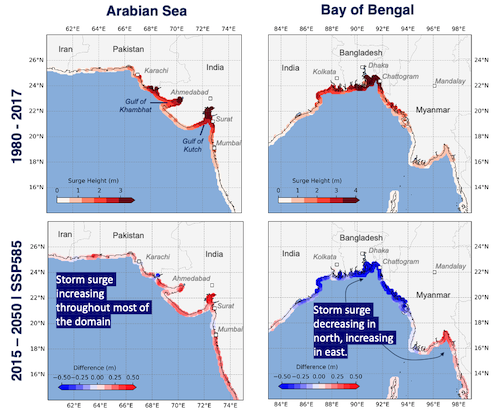
The image below shows examples of coastal 100-yr return levels in the Arabian Sea and Bay of Bengal.
Local Flood Extent Example
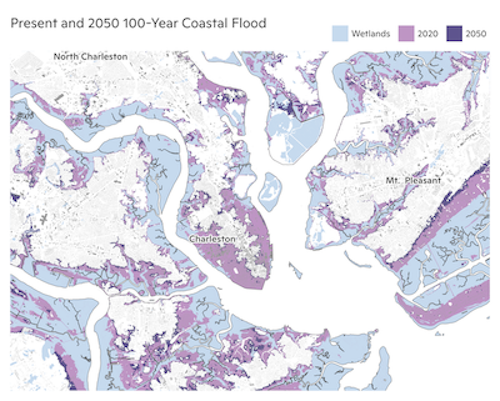
The image below shows an example of flood extent mapping for Charleston in South Carolina.
References
[1] https://www.jstor.org/publisher/wcrc
[2] https://www.woodwellclimate.org/project/just-access/.
[3] Bloemendaal, N., Haigh, I.D., de Moel, H. et al. Generation of a global synthetic tropical cyclone hazard dataset using STORM. Sci Data 7, 40 (2020). https://doi.org/10.1038/s41597-020-0381-2
[4] Nadia Bloemendaal et al., A globally consistent local-scale assessment of future tropical cyclone risk.Sci. Adv.8,eabm8438(2022).
[5] Holland, G. J., 1980: An Analytic Model of the Wind and Pressure Profiles in Hurricanes. Mon. Wea. Rev., 108, 1212– 1218
[6] Peng, S., Li, Y. A parabolic model of drag coefficient for storm surge simulation in the South China Sea. Sci Rep 5, 15496 (2015). https://doi.org/10.1038/srep15496
[7] Shchepetkin, A., and J.C. McWilliams, 2005: The Regional Oceanic Modeling System: A split-explicit, free-surface, topography-following-coordinate ocean model. Ocean Modelling, 9, 347-404.
[8] Dominick Dusseau, Zachary Zobel, Christopher R. Schwalm, DiluviumDEM: Enhanced accuracy in global coastal digital elevation models, Remote Sensing of Environment, Volume 298, 2023, 113812, ISSN 0034-4257
[9] Byrne, D., Polton, J., O’Dea, E., and Williams, J.: Using the COAsT Python package to develop a standardised validation workflow for ocean physics models, Geosci. Model Dev., 16, 3749–3764,